
Intro
The Roosters and Knights arrive at Accor Stadium with season records of 18-9 and 17-10 respectively, so there is less between their overall campaigns than the market might initially suggest. Their recent schedules have been broadly similar in difficulty. Sydney have shown the higher attacking ceiling and the cleaner defensive numbers, while Newcastle still carry enough running threat to turn a loose contest into a scrap. The question for punters is whether the Roosters have done enough lately to justify clear favouritism.
The best price for Roosters is $1.45 with BetRight, offering 1.6% better return than the average market price. The best price for Knights is $2.90 with Sportsbet, offering 1.5% better return than the average market price.
Recent Form
The Roosters enter at 18-9 and have scored 25.2 points per game across their past five, almost dead level with the league mean of 25.3. Their completion rate over that stretch is 76%, behind Newcastle's 77.4% and the league mean of 77.9%. There is plenty of movement inside that Sydney number. Their completion dropped to 62% against the Rabbitohs in Round 27 before reaching 85% against the Dolphins in Finals Week 3. That latest match also brought 36 points, while the previous game produced 46 against the Sharks, giving the Roosters genuine attacking momentum at the right time.
Margin
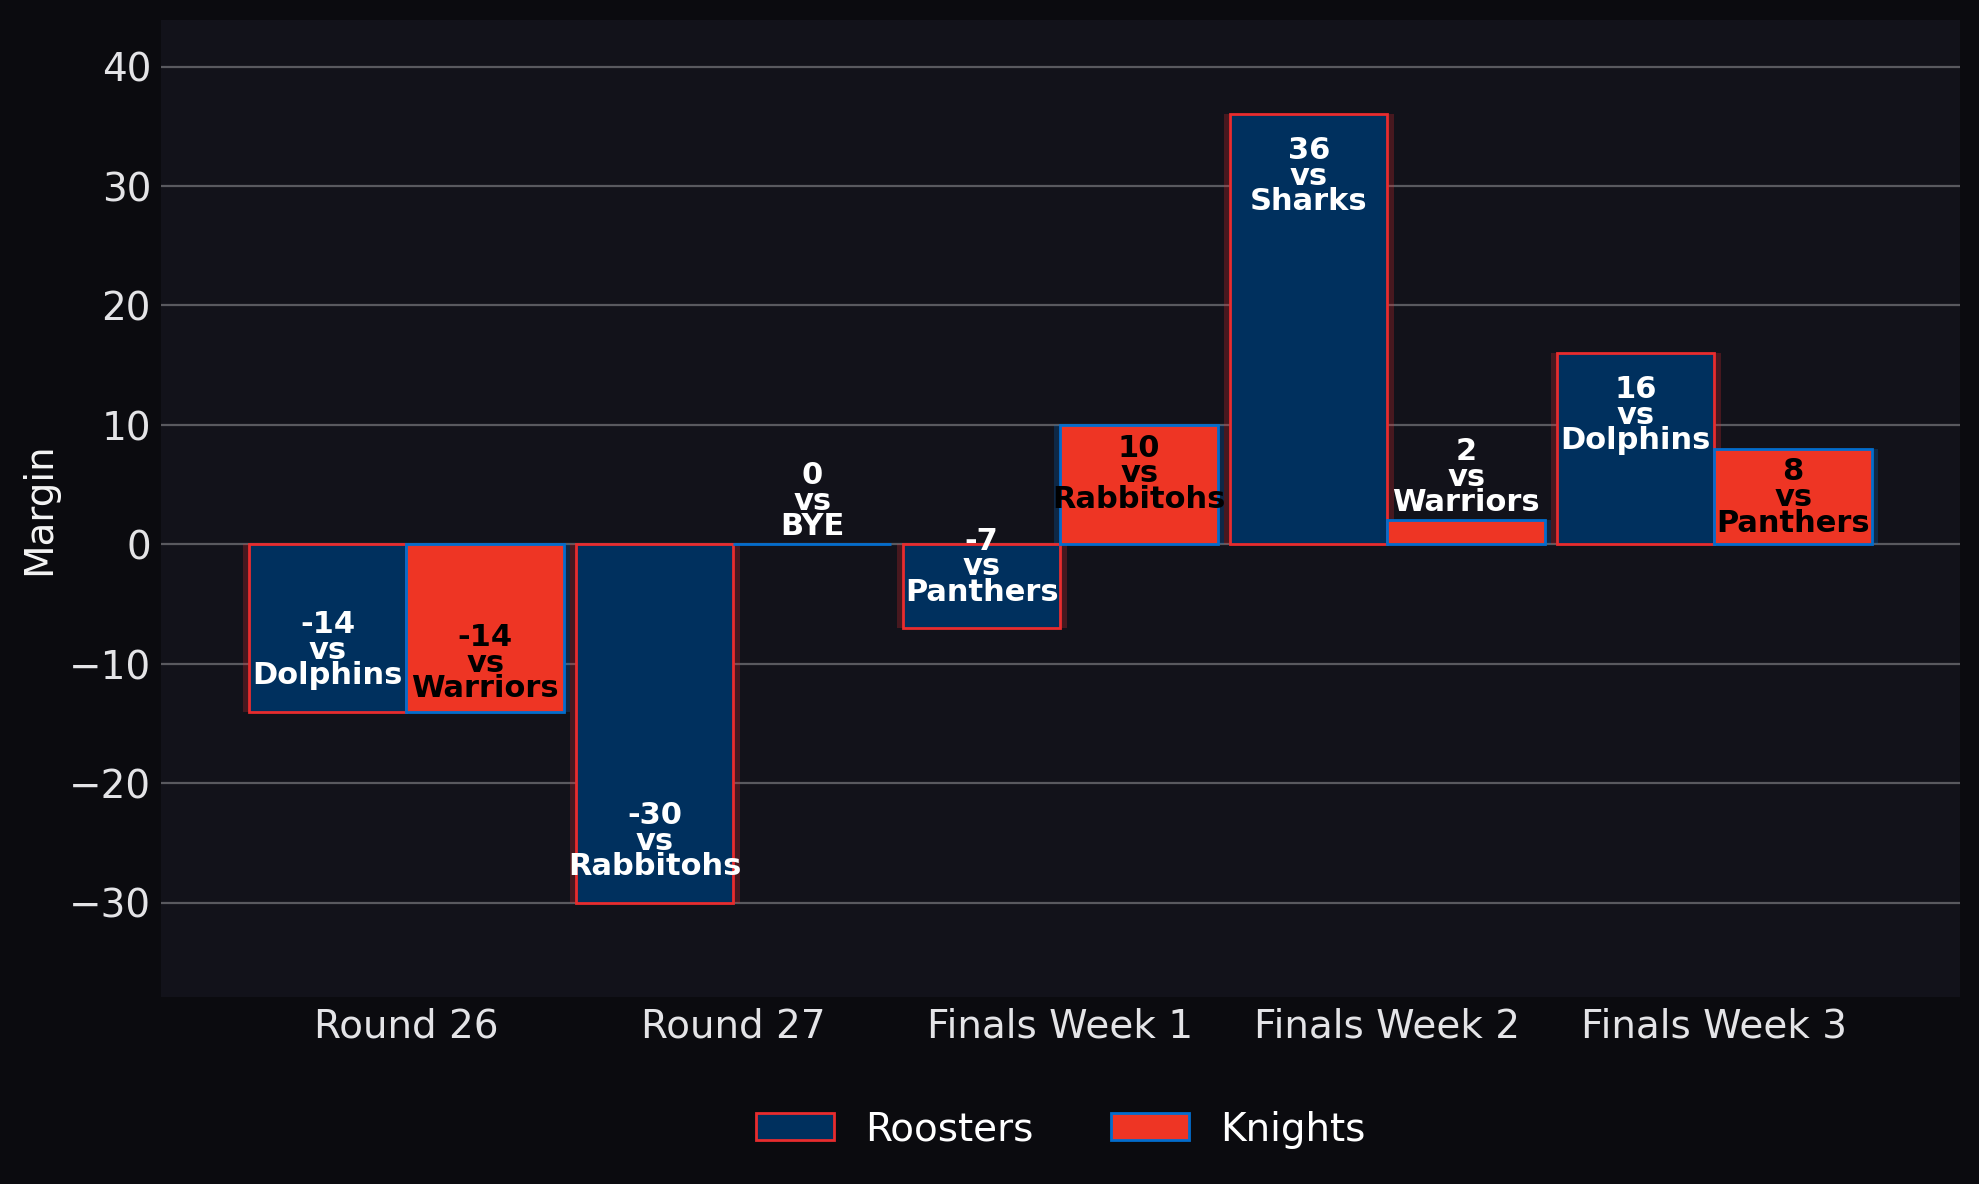
Margin combines scoring and defence into one number and anchors the recent form story.
Completion rate

The first recent form paragraph compares the Roosters at 76% with the Knights at 77.4% and the league benchmark.
Newcastle come in at 17-10 and have scored 22 points per game across their past five, which is 3.2 fewer than Sydney and below the league mean of 25.3. The Knights have generated 1570.8 run metres per game over that span against a league average of 1613.5. Their 1839 metres against the Rabbitohs in Finals Week 1 is the clear high point and needs to be treated as such, while their most recent outing against Penrith produced 1516 metres. Newcastle's opponents have made 12.4 errors per game across the same window compared with only 9.4 by Roosters opponents, so Sydney's recent work has not depended on sides simply handing them possession.
Strengths & Weaknesses
The clearest Roosters attacking strength is their willingness to keep the ball alive. They have produced 10.4 offloads per game across the past five, more than three above the league mean of 6.9. That figure carries a giant Round 26 outlier when Sydney threw 23 offloads against the Dolphins, so it would be reckless to expect that every week. Even with that caveat, the Roosters have shown they can turn ordinary possessions into second phase football. Their opponents have completed at 81.4% across the same period compared with 78.6% against Newcastle, which makes Sydney's defensive work more notable given they have often been asked to defend completed sets.
Offloads

The Roosters' 10.4 offloads per game are a major part of their recent attacking approach and sit well above the league mean.
The raw defensive comparison still favours the Roosters. Sydney have missed 33 tackles per game across their past five compared with Newcastle's 39.8. The Roosters sit three misses better than the league mean of 36, while the Knights sit 3.8 above it. Newcastle's figure is inflated by 62 missed tackles against the Warriors in Finals Week 2, but it remains a concern rather than something one bad night can completely explain away. Knights opponents have also made 5.8 line breaks per game compared with 5 against Sydney, with both figures above the league mean of 4.6. That gives the Roosters the stronger defensive base if this game starts stretching.

Key Players
James Tedesco remains a major source of creation for the Roosters with 1.6 line break assists per game across his past five appearances, and that has climbed to 2 per game over his latest three. Robert Toia has delivered 1.4 line breaks and 5.4 tackle busts per game across his past five, while scoring 1 try per game over the same stretch. Mark Nawaqanitawase has also scored 1 try per game across his past five and produced 61.8 post contact metres per game, giving Sydney another powerful outside back option. Benaiah Ioelu returns this week after producing 6 post contact metres in his previous appearance, while Spencer Leniu also returns after averaging 20 post contact metres per game across his past five appearances.
James Tedesco — Line break assists

Tedesco has produced 1.6 line break assists per game across his past five appearances and remains one of Sydney's main creators. The league average is based on players in the same position and is calculated using recent performance data across the competition.
Kalyn Ponga has averaged 151.2 run metres and 1.2 line breaks per game across his past five appearances, with his running rising to 189.3 metres per game over his latest three. Greg Marzhew has carried an even heavier load with 180.4 run metres and 5.6 tackle busts per game across his past five. Bradman Best has added 141.6 run metres and 0.6 try assists per game during the same span. Sandon Smith has produced 74.6 run metres and 0.6 try assists per game across his past five, although his 5 missed tackles per game over that period remain a defensive concern. Thomas Cant returns this week after averaging 21.4 run metres per game across his past five appearances, while Fletcher Hunt returns with 78 run metres per game across his past five.
Kalyn Ponga — Run metres

Ponga has averaged 151.2 run metres across his past five appearances and his running output has lifted in recent weeks. The league average is based on players in the same position and is calculated using recent performance data across the competition.
Tactical Outlook
Territory alone does not offer much separation. The Knights have gained 40.4 metres per set across their past five compared with 40.3 for the Roosters, with both sitting close to the league mean of 40.6. Sydney's own range has been wide, from 33.8 metres against the Rabbitohs in Round 27 to 44.9 against the Dolphins in Round 26, so that average hides some volatility. With territory effectively cancelling out, the game should turn more on what happens after first contact. Sydney's capacity to create second phase football meets a Newcastle defence that has conceded more line breaks and missed more tackles. If the Roosters keep possessions alive, that could become a long night of scrambling for the Knights.

Prediction & Value Bet
The Roosters still look more likely to win because their recent attack has produced the higher scoring average and their defence has missed fewer tackles while allowing fewer line breaks. Newcastle have enough carrying power to make this uncomfortable, but the Roosters appear better equipped to survive an open contest and create again when the first attacking shape breaks down. We assess the Roosters at a fair 72% chance and Newcastle at 28%. The Roosters are $1.43 in the current market with a market implied probability of 70.1%. The Knights are $2.86 in the current market with a market implied probability of 35%. Our fair probability for Sydney sits above the market figure, giving the favourite additional cushion compared with the odds. The tip is the Roosters to win and the recommended bet is Roosters head to head.
Check out other markets for this match: