
Intro
The Panthers enter this finals clash as clear favourites, but the price asks punters to decide whether their recent defensive control outweighs a Roosters side strengthened by several important returns. Penrith have the better season record and have conceded far less across the past five games, while Sydney have enough individual attacking threat to make this more interesting than the headline odds suggest. The teams have faced broadly similar recent schedules. The market question is whether the Panthers at $1.35 with a market implied probability of 73.8% still offer enough room at the current price.
The best price for Panthers is $1.37 with BetR, offering 1.2% better return than the average market price. The best price for Roosters is $3.25 with Bet365, offering 1.9% better return than the average market price.
Recent Form
Penrith arrive with an 18-6 season record and a defensive run that gives them the strongest foundation in this matchup. Their opponents have scored just 14.8 points a game across the past five, while the Panthers themselves have produced 20.4. Their 81.6% completion rate is also better than the league mean of 79.2%. There has been some volatility inside that number, with Penrith completing 73% against the Roosters in Round 24 before reaching 93% against the Bulldogs in Round 26. Their most recent completion figure was 85% against Tigers, so the Round 24 dip has not defined the wider run.
Margin
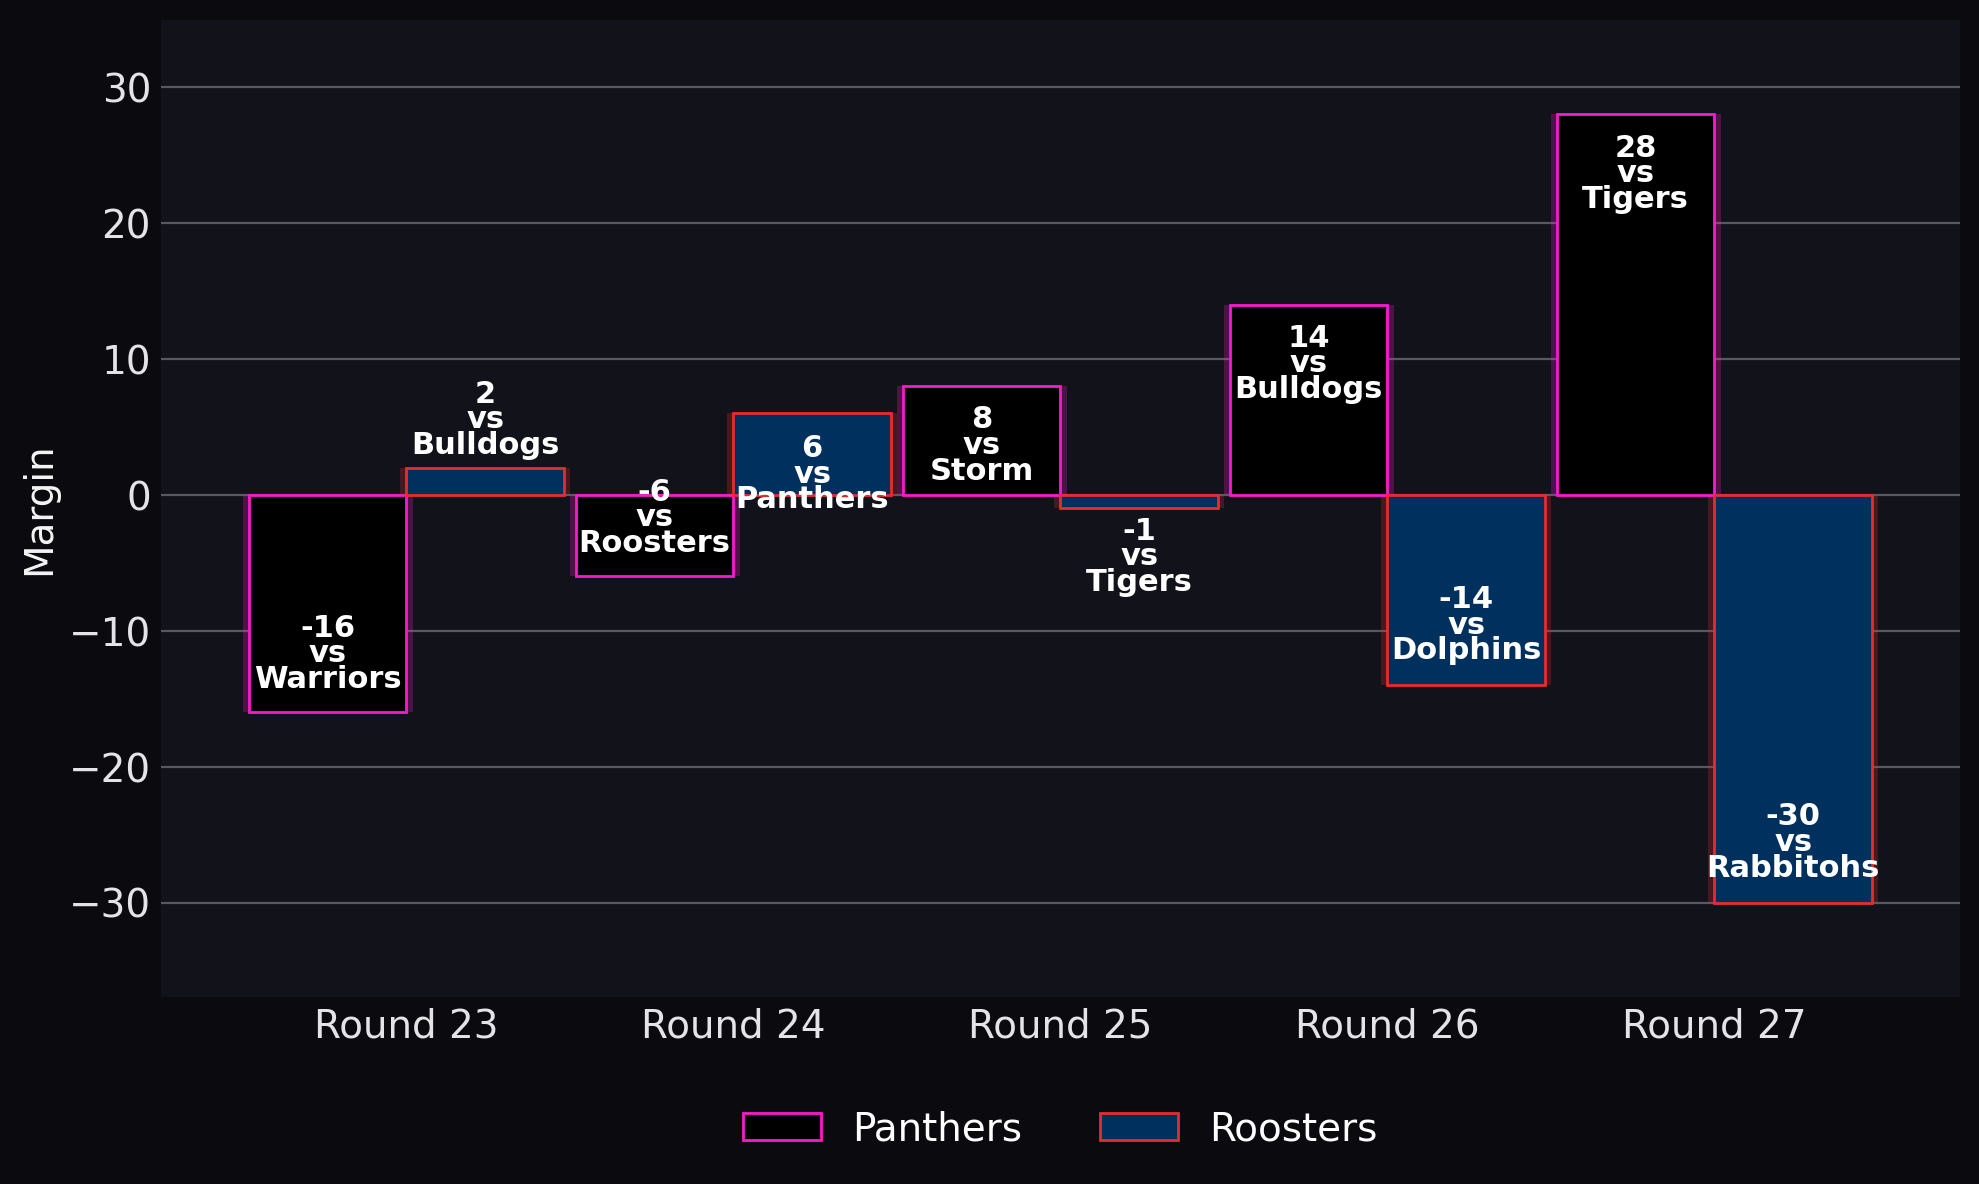
Margin combines scoring and defence into one number and anchors the recent form story.
The Roosters carry a 16-8 record into the game, but their recent attack has been quieter at 17.6 points per game. Their completion rate over the same span is 74.6%, nearly five percentage points below the league mean and seven points below Penrith. The most recent match was also the clear low point, with a 62% completion rate against the Rabbitohs in Round 27. Opponents have scored 25 points per game against the Roosters over the past five, which is 10.2 more than Penrith have conceded in their corresponding run. With the recent schedules broadly similar, that defensive gap is difficult to brush aside.
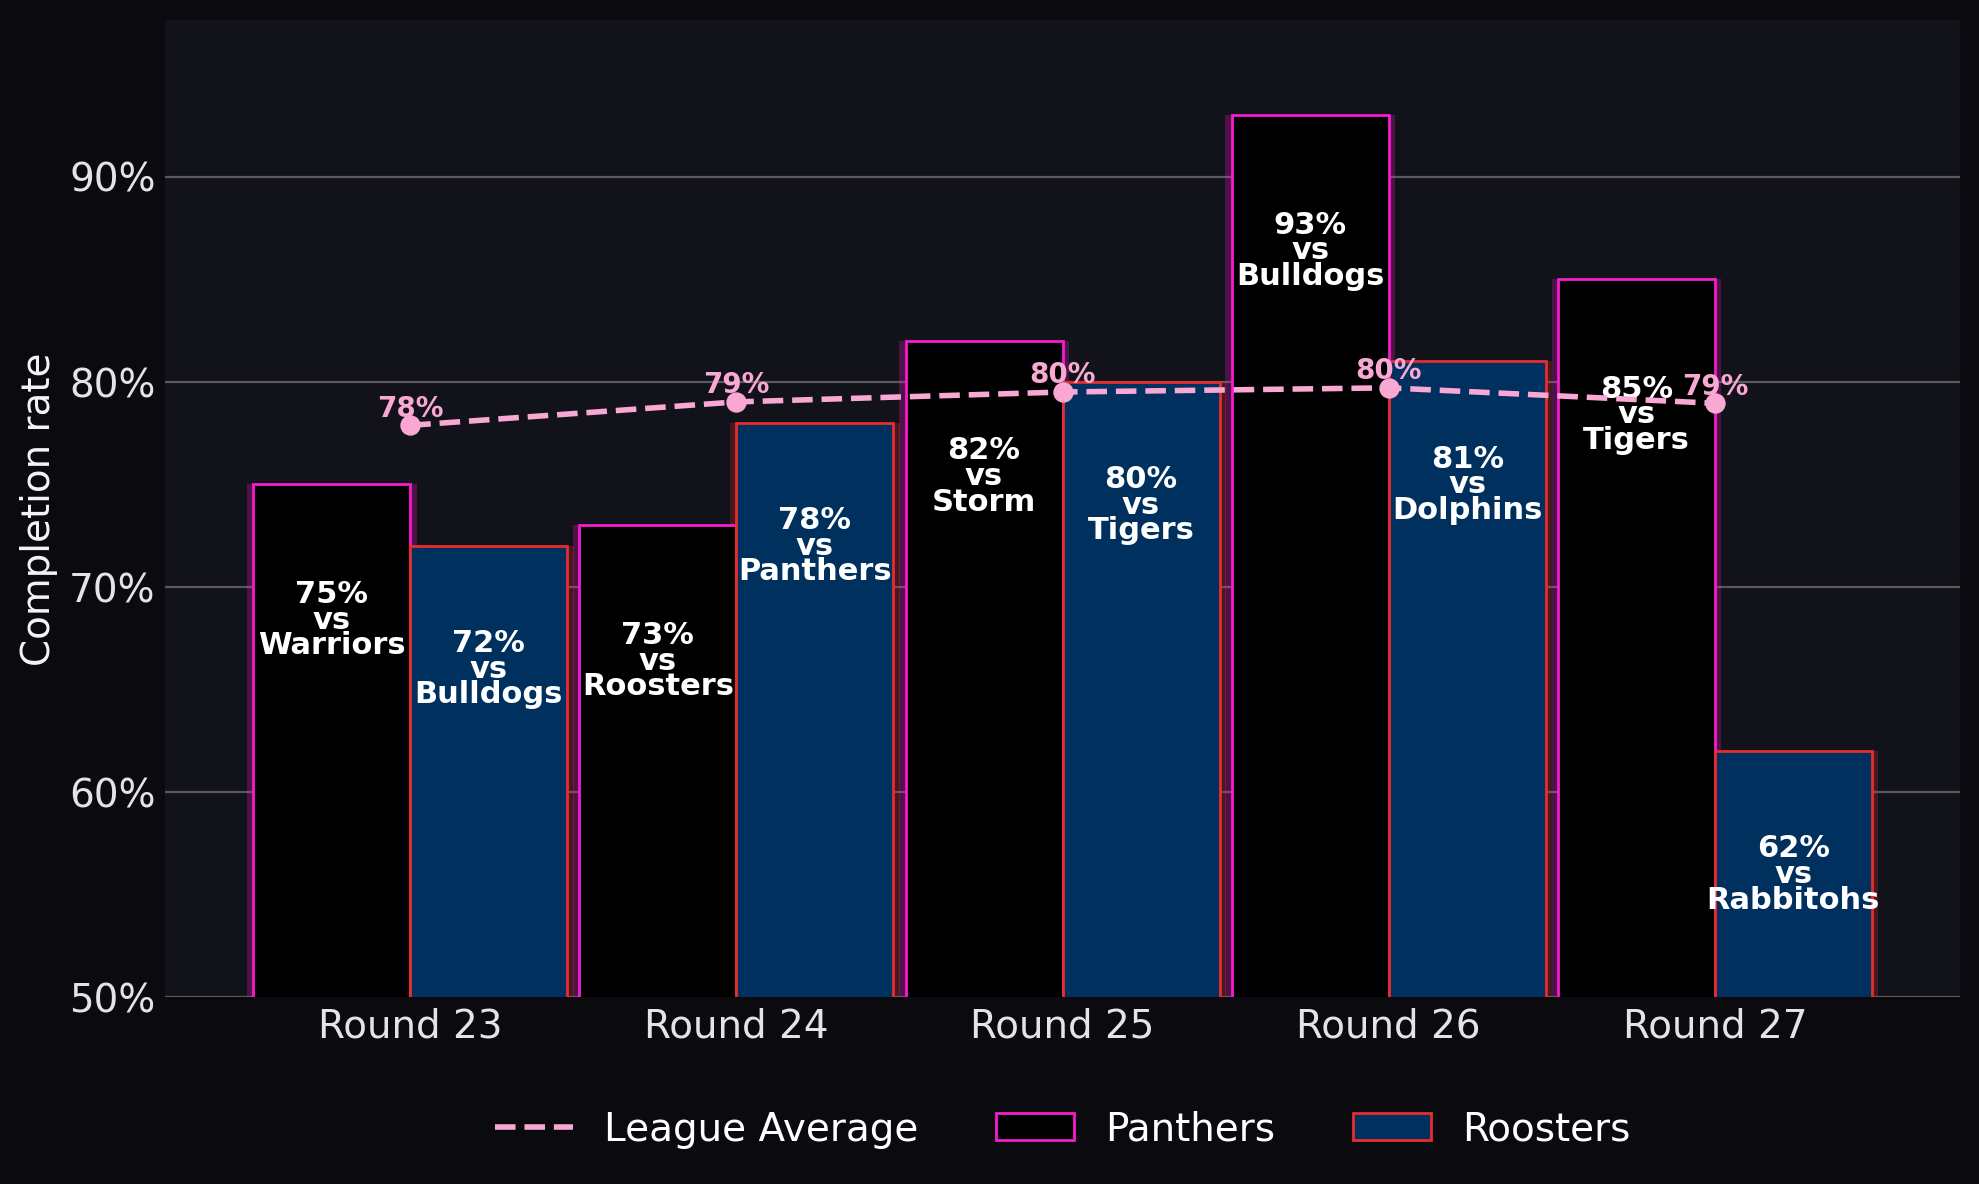
Strengths & Weaknesses
Penrith's control with the ball is reinforced by their error count. They have made 10.6 errors a game across their past five, just below the league mean of 10.8, compared with 12.2 for the Roosters. Penrith's Round 24 total of 16 errors against these same Roosters was the obvious outlier in that stretch. The Panthers have also missed 34.8 tackles per game, slightly better than the league mean of 35.5, although the Roosters are cleaner on that raw defensive measure at 32.8. One advantage therefore cancels out another. Penrith protect possession better, while Sydney have missed fewer tackles.

Missed tackles

The Roosters hold the better raw missed tackle figure despite Penrith's stronger scoring defence.
Neither side has consistently rolled downfield with ease. Penrith have gained 37.9 metres per set across the last five and the Roosters 37.8, with both sitting below the league mean of 40.7. That almost perfectly cancels out. The more revealing concern is what each defence has allowed on the ground. Penrith's opponents have gained 1663.8 run metres per game, compared with a league mean of 1621.4, while Roosters opponents have reached 1681.6. Both sides have therefore given up more yardage than the competition average, despite their different scoring returns. Penrith have been much better at stopping those metres becoming points.
Average set distance

The sides have produced almost identical recent yardage per set and both sit below the league mean.
Key Players
Casey McLean gives Penrith a sharp attacking option after producing 1 line break per game across his past five and lifting that output to 1.3 over his most recent three. Thomas Jenkins has supplied even more regular penetration with 1.6 line breaks per game across his past five, rising to 2 in his latest three. Brian To'o adds another powerful route through the back five with 197 run metres per game across five matches and 221.7 over his most recent three. Nathan Cleary has generated 1.2 line break assists per game across his past five, giving Penrith another source of creation around those dangerous outside backs.
Casey McLean — Line breaks

McLean has produced a line break per game across his past five and has lifted that output recently. The league average is based on players in the same position and is calculated using recent performance data across the competition.
The Roosters regain plenty of attacking class and Egan Butcher remains in the side. James Tedesco returns this week after producing 1.2 try assists per game across his past five and 1.3 over his latest three. Billy Smith also returns after recording 1.4 line breaks per game across five games. Daly Cherry-Evans is back as well after averaging 0.8 line break assists across his past five and lifting that to 1.3 across his most recent three. Egan Butcher has 8 post-contact metres per game across his past five and 13.3 over his latest three, while Siua Wong also returns after producing 38.8 post-contact metres per game across his past five.
James Tedesco — Try assists

Tedesco returns with the strongest recent creative output among the Roosters players supplied. The league average is based on players in the same position and is calculated using recent performance data across the competition.
Tactical Outlook
This looks more likely to be decided by who owns possession than by who dominates the middle through raw yardage. The teams are virtually identical for recent set distance, but Penrith have completed at 81.6% compared with Sydney's 74.6% and have made 1.6 fewer errors per game. That gives the Panthers a clearer path to building pressure through repeated sets rather than relying on spectacular attacking bursts. The Roosters' route is different. With Tedesco, Smith and Cherry-Evans returning, and Butcher retained in the side, they have more attacking options than their recent team numbers alone suggest. Their 32.8 missed tackles per game also compares favourably with the league mean of 35.5. Penrith should still be more comfortable if the match becomes a grind, particularly given Roosters opponents have gained 1681.6 metres per game compared with 1663.8 against Penrith.
Prediction & Value Bet
Penrith are the more likely winners because their recent defensive return, stronger completion rate and lower error count provide the safer finals formula. The Roosters' returning personnel adds genuine attacking danger, but it does not overturn the broader matchup. We rate the Panthers a 74% chance of winning and the Roosters a 26% chance. The Panthers are $1.35 with a market implied probability of 73.8%. Our 74% fair assessment now sits fractionally above that market mark, giving the favourite a small amount of additional cushion at the updated price. The Roosters are $3.19 with a market implied probability of 31.3%. Our 26% fair probability remains well below that figure, so the underdog does not appeal at the current price. The tip is Panthers to win and, with the market now just below our fair probability, the recommendation is Panthers head to head.
Check out other markets for this match: